
Please see below update – valid on 04/09/2021
Often in a time series chart in Google Data Studio we want to reference particular key events: website updates, important media activations etc. We can do this in Google Analytics & Google Ads but there is not an out the box way to add a note or annotations in Data Studio.
There is a current workaround. Adding a new custom metric
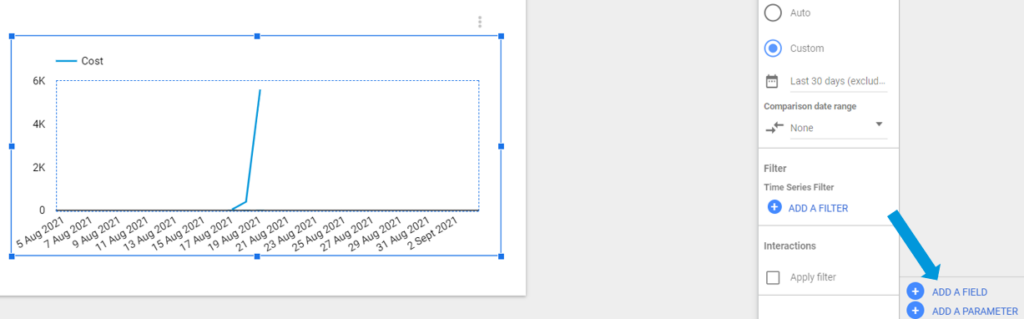
- Click +Add A Field in a time series chart in which you want to add a particular event or date (easy way to access this is to click on the time series chart and look in the bottom right of screen as below)
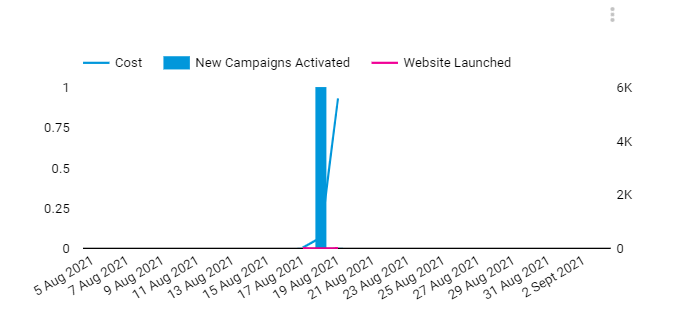
- We have used the below script to change the metric for DATE to set a value of 1 – the 1 being the additional value we need to see in the time series chart.
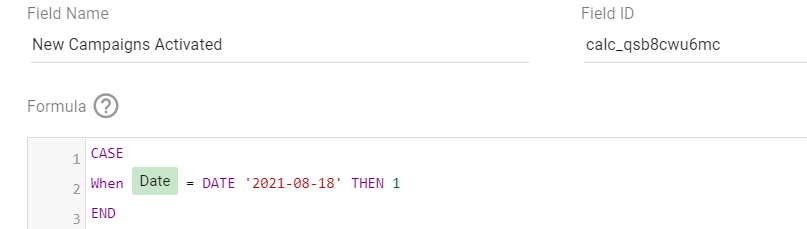
CASE
When Date = DATE '2021-08-18' THEN 1
END
Still not working? Check our potential fixes below
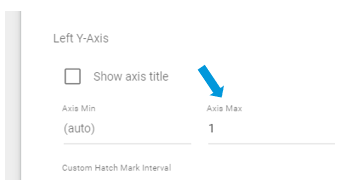
- Click on your time series chart and go the In the style section towards the top right of the screen
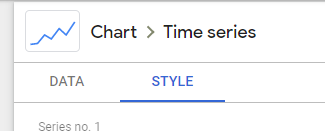
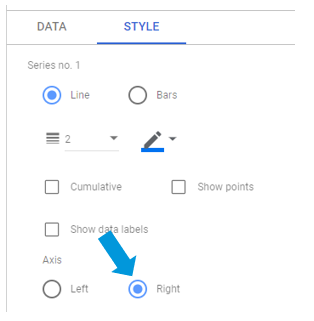
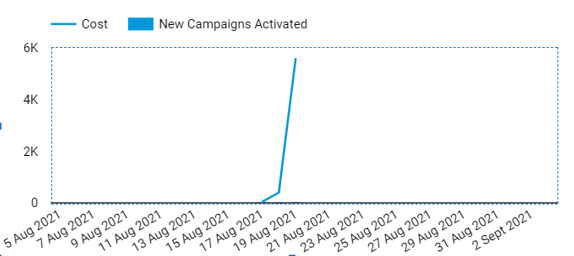
- Now if your chart is showing a line instead of a bar. Simply change the value to a bar chart. To do this select your time series chart. Go to STYLE in the top right. Change the appropriate metric to a bar
Stuck still? Feel free to add a comment below and we can help you through! If you got something out of this feel free to share, rate the article or comment below!

Great workaround! This is exactly what I was looking for.
However, after I click “add a metric in the metric section” within a time series chart, I’m not seeing an option to add a “custom metric” — only “create field.”
Am I missing something?
Hey Zach! Thanks for reaching out. Hope the above updated fix works and do let us know if you get stuck
Comments are closed.